Tables are declared in data.html, all with the declaration of the body, some with some all the headers as well.
Customized : with html headers
Code extract: Table declaration
<table id="fsiTable" class="table table-striped">
    <thead>
        <tr>
            <!--<th>Image</th>-->
            <th>Indicator Name</th>
            <th>Value</th>
            <th>Risk</th>
            <th>Evolution</th>
            <!--<br> <th>Evolution (5 years)</th>-->
        </tr>
    </thead>
    <tbody>
        <!-- Table rows will be populated by JavaScript -->
    </tbody>
</table>
fsiTable
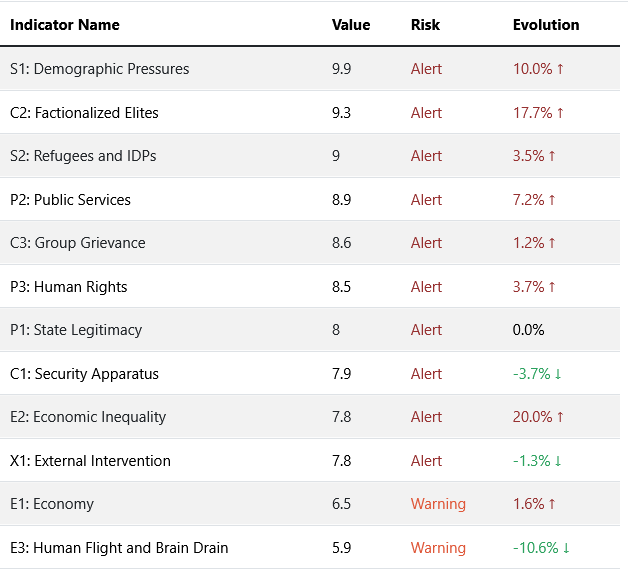
Function: prepareFsiDataTable, generateFsiTable
Variables:
-
fsi_def : data.fsi_def from table
fsi_definitions -
data: data.fsi_allyear from table
fsi_exports
Description: There are two functions, one for generating the data linking definitions and results, the other for displaying the table.
Code extract: Extract first and last years value and link to definitions
function prepareFsiDataTable(fsi_def, fsi_allyear) {

    // Find the object with the highest year_fsi value
    const latestYearData = fsi_allyear.reduce((latest, current) => {
        return (current.year_fsi > latest.year_fsi) ? current : latest;
    }, fsi_allyear[0]);

    const firstYearData = fsi_allyear.reduce((first, current) => {
        return (current.year_fsi < first.year_fsi) ? current : first;
    }, fsi_allyear[0]);

    // Add the selected_value and latest_year to each item in fsi_def
    fsi_def.forEach(item => {
        const latestValue = latestYearData[item.col_name] || 'N/A';
        const firstValue = firstYearData ? firstYearData[item.col_name] : 'N/A';
        item.selected_value = latestValue;
        item.latest_year = latestYearData.year_fsi;

        // Calculate the evolution percentage
        if (latestValue !== 'N/A' && firstValue !== 'N/A') {
            item.evolution = ((latestValue - firstValue) / firstValue * 100).toFixed(2) + '%';
        } else {
            item.evolution = 'N/A';
        }
        item.allYearValues = fsi_allyear.map(yearData => ({
            year: yearData.year_fsi,
            value: yearData[item.col_name] || 'N/A'
        }));
    });

    // Reorder by decreasing selected_value
    fsi_def.sort((a, b) => b.selected_value - a.selected_value);

    return fsi_def;
}
acledTable
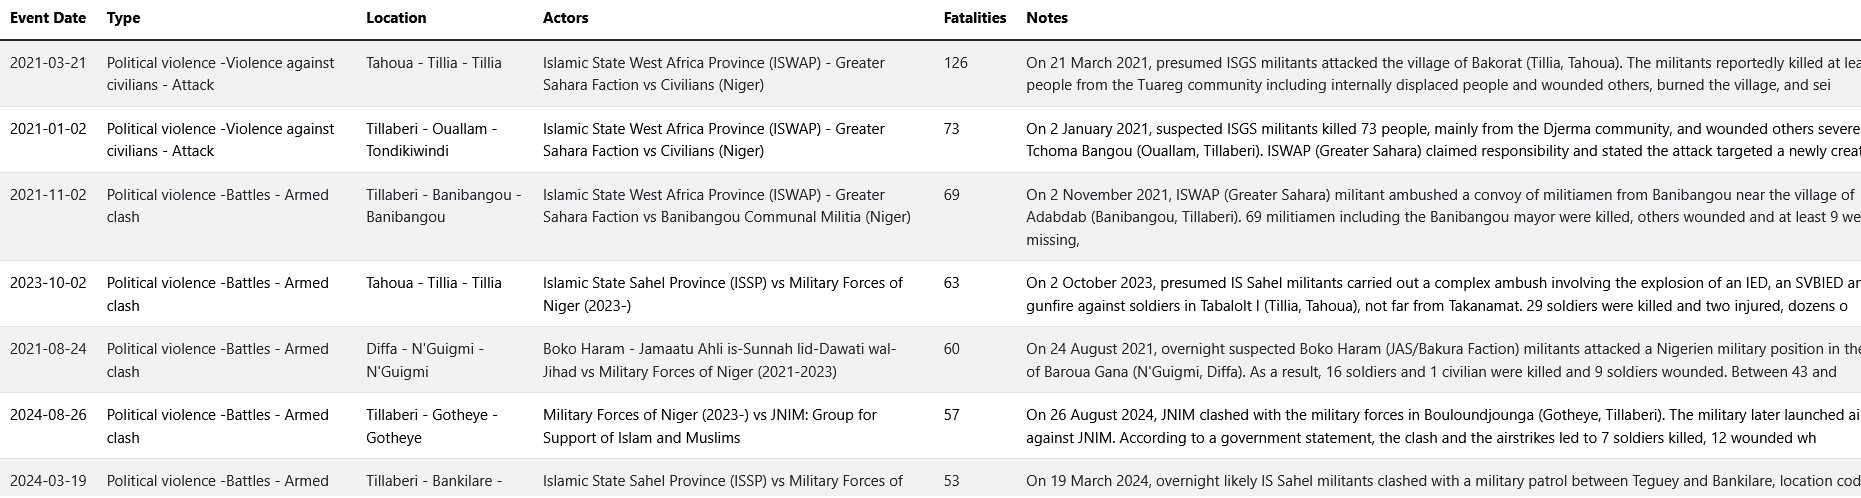
Function: generateAcledTable
Variables:
- features: filtered data on the map and time filters
Description: Display a table with the 10 events with most fatalities appearing on the map
Code extract: Create cells and row for each selected feature.
function generateAcledTable(features) {

    if (!Array.isArray(features) || features.length === 0) {
        console.error('Expected a non-empty array of features, but got:', features);
        return;
    }
    const tableBody = document.querySelector('#acledTable tbody');
    tableBody.innerHTML = ''; // Clear existing table rows

    // Sort features by number of fatalities in descending order
    const sortedFeatures = features.sort((a, b) => b.properties.fatalities - a.properties.fatalities);

    // Get the top 10 events
    const topFeatures = sortedFeatures.slice(0, 10);

    topFeatures.forEach(item => {
        const row = document.createElement('tr');

        // date
        const dateCell = document.createElement('td');
        dateCell.textContent = item.properties.event_date;
        row.appendChild(dateCell);

        // Event type
        const eventTypeCell = document.createElement('td');
        eventTypeCell.textContent = `${item.properties.disorder_type} -${item.properties.event_type} - ${item.properties.sub_event_type}`;
        row.appendChild(eventTypeCell);

        // Location
        const locationCell = document.createElement('td');
        locationCell.textContent = `${item.properties.admin1} - ${item.properties.admin2} - ${item.properties.admin3}`;
        row.appendChild(locationCell);

        // Actors
        const actorsCell = document.createElement('td');
        actorsCell.textContent = `${item.properties.actor1} vs ${item.properties.actor2}`;
        row.appendChild(actorsCell);

        // Fatalities
        const fatalitiesCell = document.createElement('td');
        fatalitiesCell.textContent = item.properties.fatalities;
        row.appendChild(fatalitiesCell);

        // Notes
        const notesCell = document.createElement('td');
        notesCell.textContent = item.properties.notes;
        row.appendChild(notesCell);

        tableBody.appendChild(row);
    });
}
Serialized: without html headers
The tables headers are also generated in Javascript. All these tables contain three columns: a dimension, # Events and # Fatalities
admin1Acled
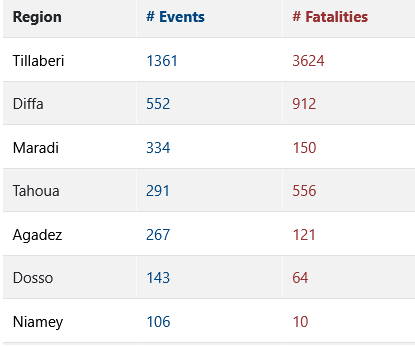
Function: createAdmin1Table
Variables:
- data: filtered data on the map and time filters
Description: Acled events and fatalities are aggregated at administrative level 1. The map is updated when clicking on a row.
Code extract: Event listener for each row zooms the map to see all features and updates other graphs
// Event listener for row click
row.addEventListener('click', () => {
    const selectedAdmin1 = item.admin1;
    const startDate = new Date(document.getElementById('startDate').value);
    const endDate = new Date(document.getElementById('endDate').value);
    console.log("startDate:", startDate);
    console.log("endDate:", endDate);
    const newFilteredData = filterByDateAndMap(features, startDate, endDate, map, selectedAdmin1, legendFilter);
    console.log('New Filtered Data:', newFilteredData); // Log the new filtered data
    if (JSON.stringify(globalFilteredData) !== JSON.stringify(newFilteredData)) {
        globalFilteredData = newFilteredData;
        updateVisualizations(globalFilteredData, map,actorsData);
        updateMapView(globalFilteredData, map); // U
    }
});
eventAcled, subeventAcledTable, actorsAcledTable
Function: createAcledDimensionTable
Variables:
-
data: filtered data on the map and time filters
-
eventTypeProperty: Column name in the database
-
tableId: name of the table in data.html
-
colname: Column name appearing in the table
Description: ACLED events and fatalities are aggregated by dimension.
Code extract: Aggregate by dimension and create table headers
// Aggregate data by dimension type
const eventTypeData = features.reduce((acc, feature) => {
    const eventType = feature.properties[eventTypeProperty];
    if (!acc[eventType]) {
        acc[eventType] = { events: 0, fatalities: 0 };
    }
    acc[eventType].events += 1;
    acc[eventType].fatalities += feature.properties.fatalities;
    return acc;
}, {});

// Convert aggregated data to an array of objects
const eventTypeArray = Object.keys(eventTypeData).map(eventType => ({
    eventType,
    events: eventTypeData[eventType].events,
    fatalities: eventTypeData[eventType].fatalities
}));

// Sort by number of events in descending order
eventTypeArray.sort((a, b) => b.events - a.events);

// Create table header
const headerRow = document.createElement('tr');
const headers = [colname, '# Events', '# Fatalities'];
headers.forEach(headerText => {
    const headerCell = document.createElement('th');
    headerCell.textContent = headerText;
    if (headerText === '# Fatalities') {
        headerCell.style.color = 'rgba(151, 49, 49,1)'; // Set header text color to red
    }
    if (headerText === '# Events') {
        headerCell.style.color = 'rgba(0, 69, 128,1)'; // Set header text color to blue
    }
    headerRow.appendChild(headerCell);
});
tableBody.appendChild(headerRow);