2025 October Update
ACLED API has been updated All elements using openAI for generation have been updated through outside scripts, in order to test the new model, chat-GPT 4.1 (normal, nano and mini) with a new cutoff date, June 1st 2024. The results have then be inserted manually in the database, but are not running through the server.
2025 June Update
 All elements using openAI for generation have been updated through outside scripts, in order to test the new model, chat-GPT 4.1 (normal, nano and mini) with a new cutoff date, June 1st 2024.
The results have then be inserted manually in the database, but are not running through the server.
All elements using openAI for generation have been updated through outside scripts, in order to test the new model, chat-GPT 4.1 (normal, nano and mini) with a new cutoff date, June 1st 2024.
The results have then be inserted manually in the database, but are not running through the server.
Elements
Timeline
Source: list_countries_cahra_ocde_manual.csv (.ods)
Link: None
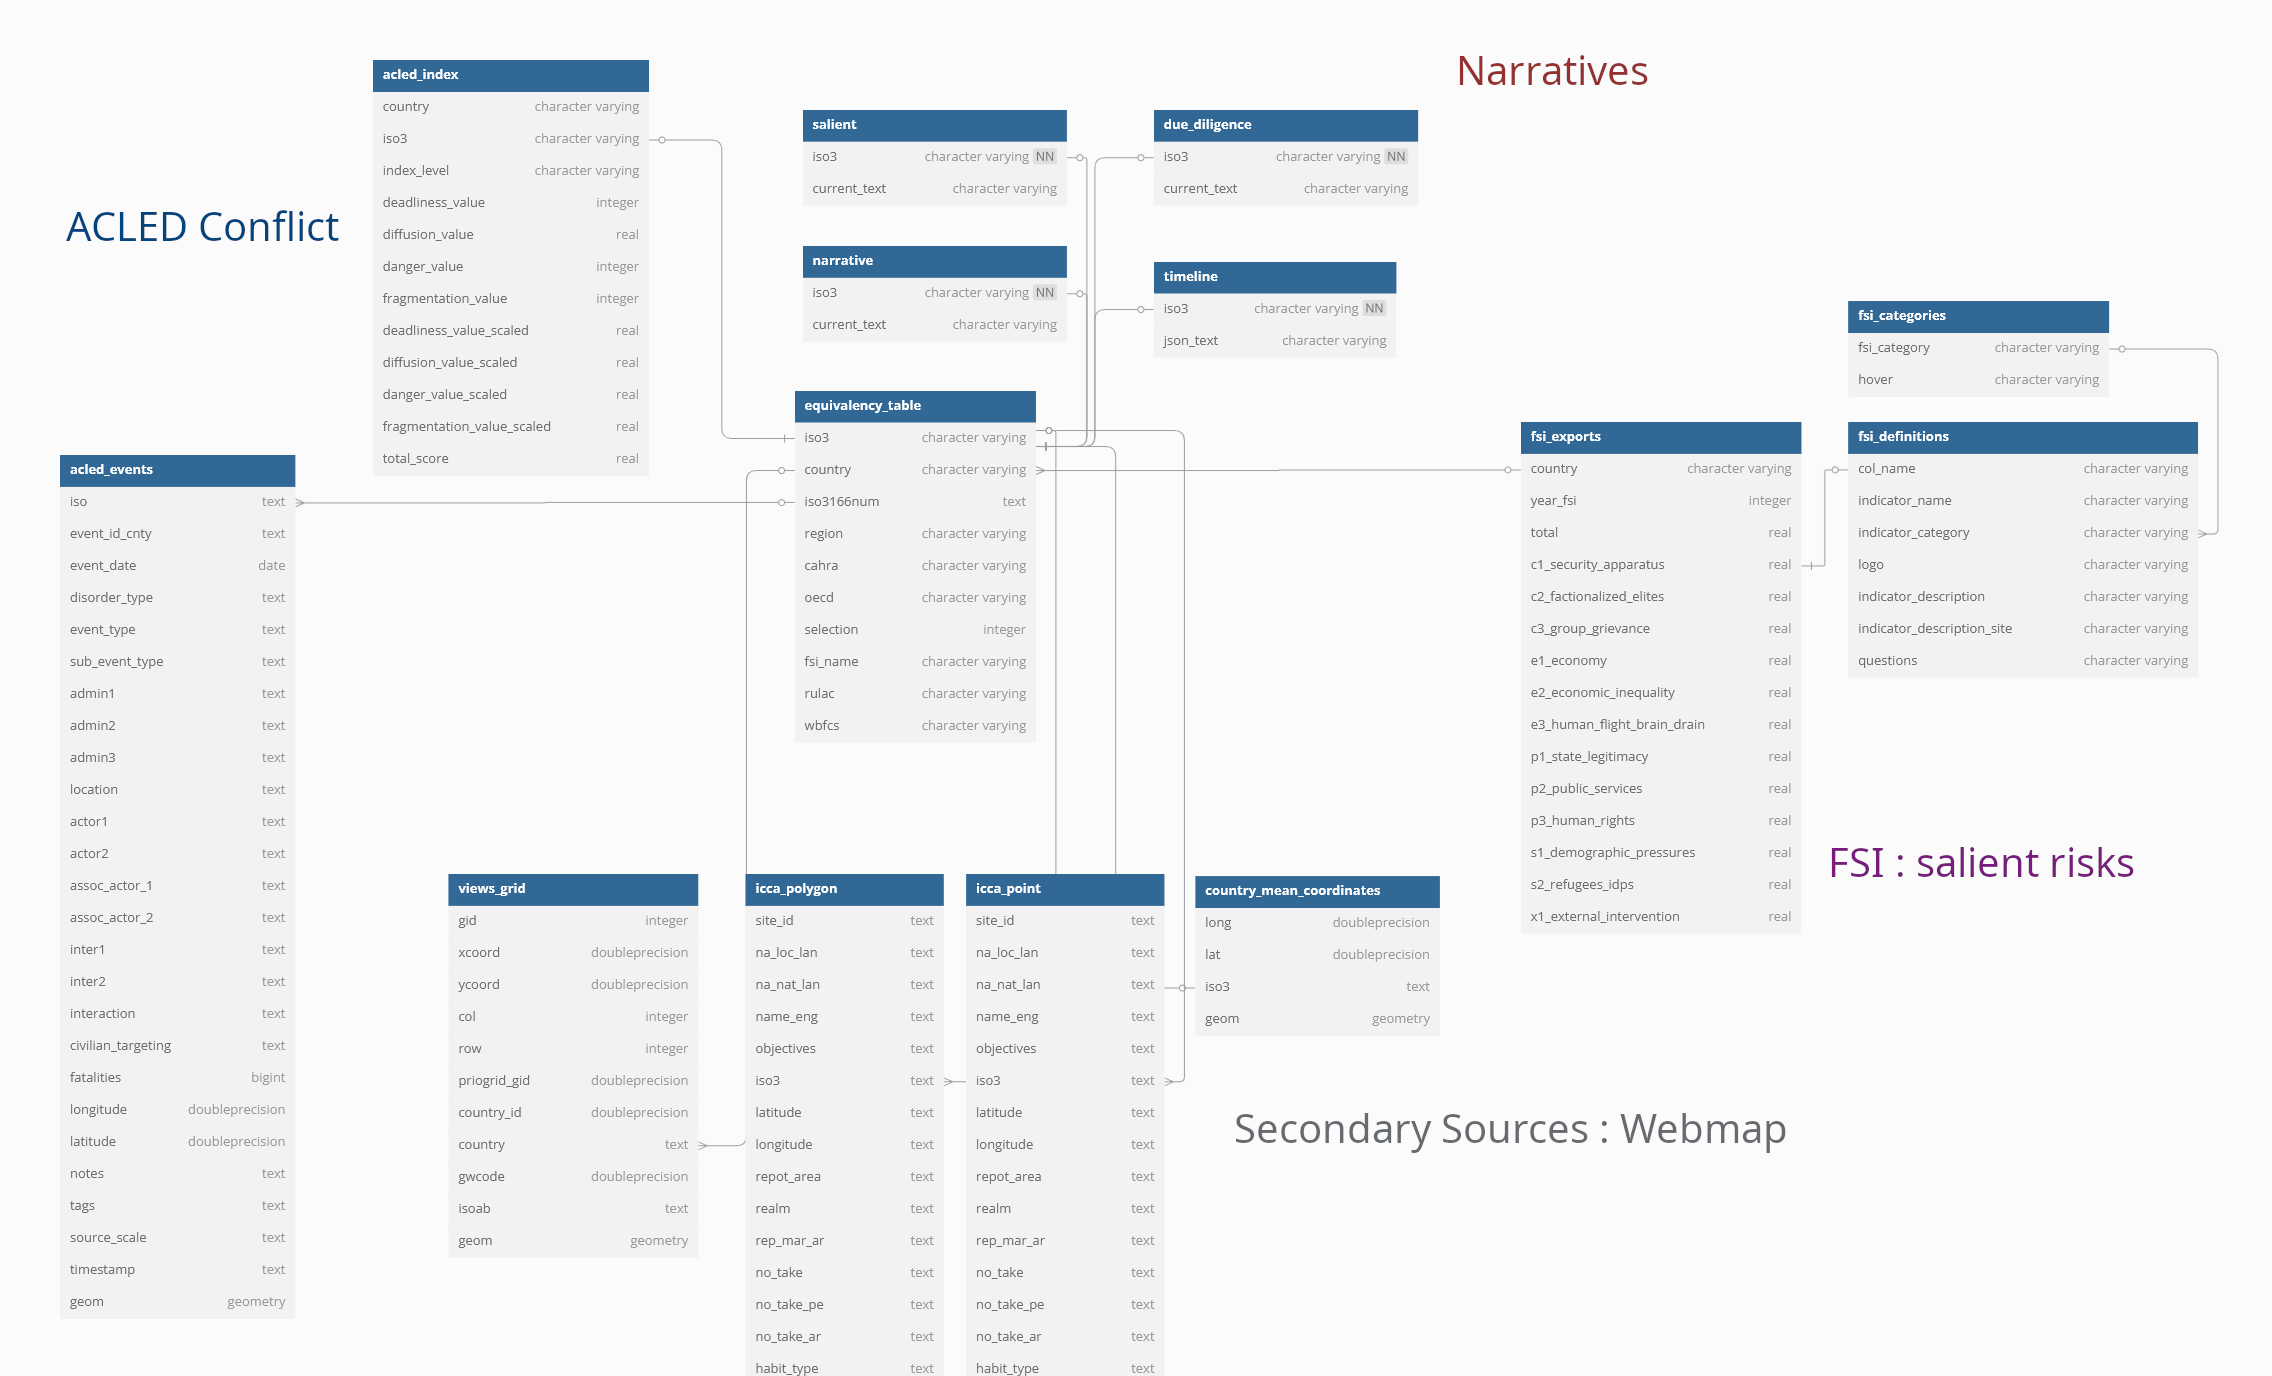
Description: Central table linking the majority of the others through country codes or names.
Data Manipulation: Created from the GeoJSON used in the index.html page and enriched with IHL data sources from CAHRA, OECD, etc. The iso3166num column may need to be updated for new datasets that do not use ISO codes. The selection value can be changed to grant or restrict access to a country.
Update Frequency: When adding a new country or dataset.
Dependent Visualizations: Most visualizations.
As displayed in the graph, the central table is called equivalency_table. It links the various tables together. Usually, the "country" column is not used for linking, as it can have different spellings (e.g., Turkey vs. Türkiye). For example, in FSI, the spelling may vary depending on the year. The most commonly used ISO3 code is used for linking. It consists of 3 letters (e.g., "MMR" for Myanmar) and is present in the country page /data/MMR.
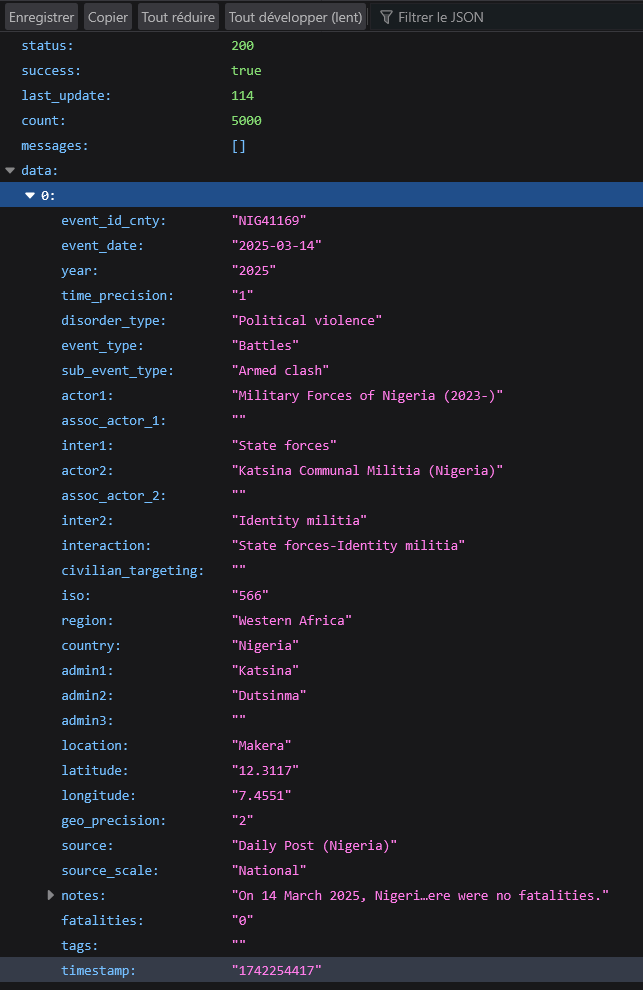
The relationship between acled_events and equivalency_table is made through the iso3166num column, which corresponds to the iso column in the ACLED dataset. It is in the format of up to 3 numbers (e.g., 4 for Afghanistan or 566 for Nigeria).
RULAC
Source: rulac_countries.csv
Link: https://www.rulac.org/
Description: RULAC classification
Data Manipulation: Manually created the list from the link
Update Frequency: TBD
Dependent Visualizations: map-selection (index.html), IHL, narrative, dd-text
Fragile State Index
fsi_categories
Source: fsi_categories.csv (.ods)
Link: None
Description: Creates hover messages for the radar chart, combining the 12 FSI dimensions into 4 categories.
Data Manipulation: Created manually. The .ods file contains conflict_intensity corresponding to INFORM, but this is no longer used.
Update Frequency: None
Dependent Visualizations: radarChartMainFour
fsi_definitions
Source: fsi_explain.csv (.ods)
Link: https://fragilestatesindex.org/indicators/
Description: Creates hover messages for the 12 dimension FSI radar chart.
Data Manipulation: Copied descriptions and questions from the webpage, added logos if needed, and added variable column names. PeaceNexus provided the indicator_description column to be used on the website.
Update Frequency: None
Dependent Visualizations: radarChartTwelve, radarChartMainFour, fsiTable
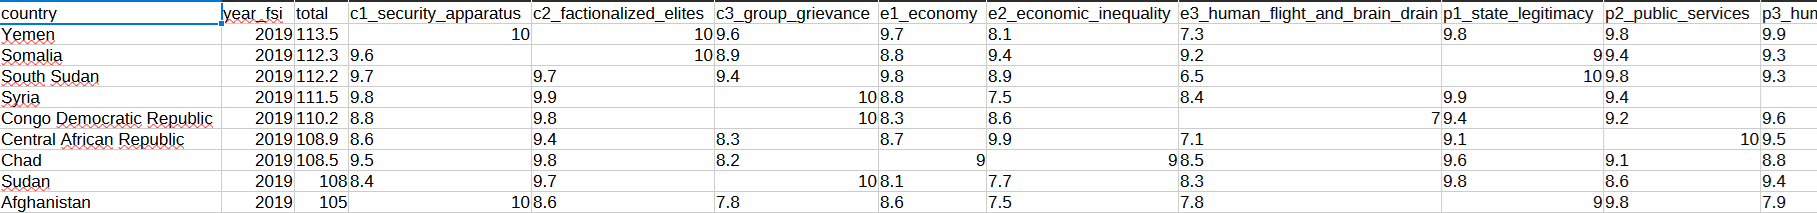
fsi_export
Source: FSI data from 2019 to 2023, Rankings (.csv)
 Link: 2024: https://public.tableau.com/views/fsi-2024-rankings/DashboardRankings?:embed=y&:showVizHome=no&:host_url=https%3A%2F%2Fpublic.tableau.com%2F&:embed_code_version=3&:tabs=no&:toolbar=yes&:animate_transition=yes&:display_static_image=no&:display_spinner=no&:display_overlay=yes&:display_count=yes&:language=en-US&:loadOrderID=0, other https://fragilestatesindex.org/excel/
Description: FSI data combining all years from 2019 (choice)
Data Manipulation: Changed names (e.g., Turkey → Türkiye, Eswatini → Swaziland, Palestine → West Bank). Removed rankings and reordered columns (2023).
Update Frequency: Yearly
Dependent Visualizations: radarChartTwelve, radarChartMainFour, fsiTable, lineChartTwelve, fsiScore, fsiRisk, fsiGaugeChart
Link: 2024: https://public.tableau.com/views/fsi-2024-rankings/DashboardRankings?:embed=y&:showVizHome=no&:host_url=https%3A%2F%2Fpublic.tableau.com%2F&:embed_code_version=3&:tabs=no&:toolbar=yes&:animate_transition=yes&:display_static_image=no&:display_spinner=no&:display_overlay=yes&:display_count=yes&:language=en-US&:loadOrderID=0, other https://fragilestatesindex.org/excel/
Description: FSI data combining all years from 2019 (choice)
Data Manipulation: Changed names (e.g., Turkey → Türkiye, Eswatini → Swaziland, Palestine → West Bank). Removed rankings and reordered columns (2023).
Update Frequency: Yearly
Dependent Visualizations: radarChartTwelve, radarChartMainFour, fsiTable, lineChartTwelve, fsiScore, fsiRisk, fsiGaugeChart
ACLED
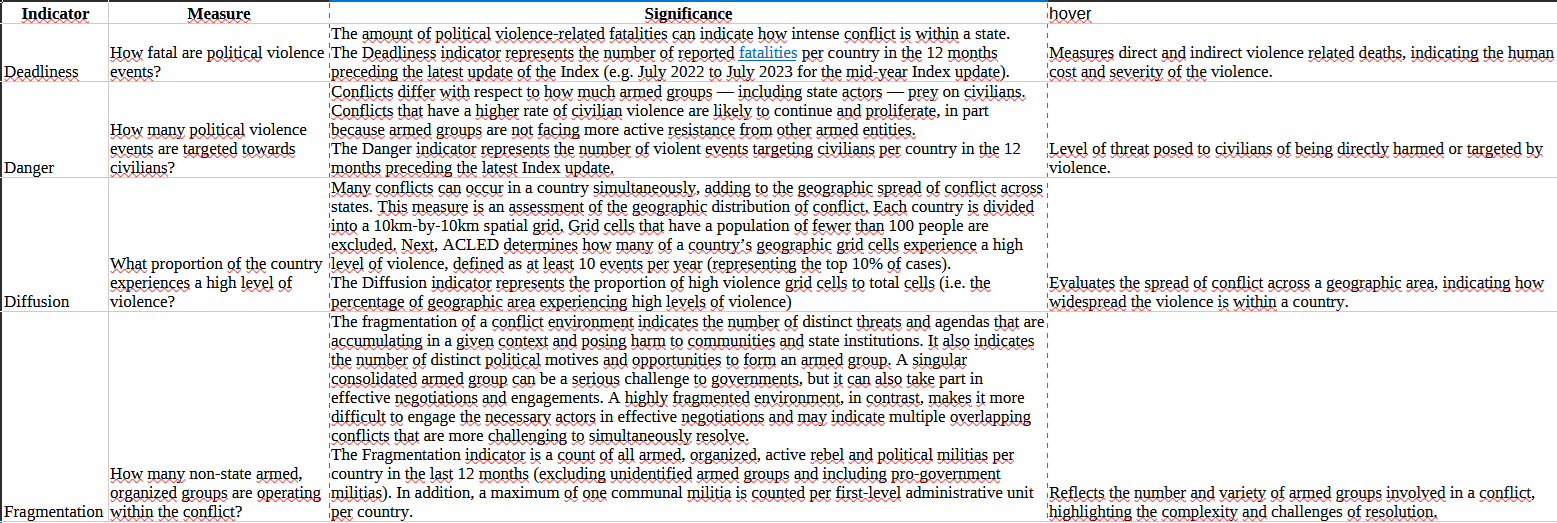
acled_index_def
Source: acled_index_def.csv (.ods)
 Link: https://acleddata.com/conflict-index/about/
Description: Creates hover messages for the radar chart displaying ACLED conflict index dimensions.
Data Manipulation: Copied from the linked page and added hover messages provided by PeaceNexus.
Update Frequency: None
Dependent Visualizations: radarChartAcled
Link: https://acleddata.com/conflict-index/about/
Description: Creates hover messages for the radar chart displaying ACLED conflict index dimensions.
Data Manipulation: Copied from the linked page and added hover messages provided by PeaceNexus.
Update Frequency: None
Dependent Visualizations: radarChartAcled
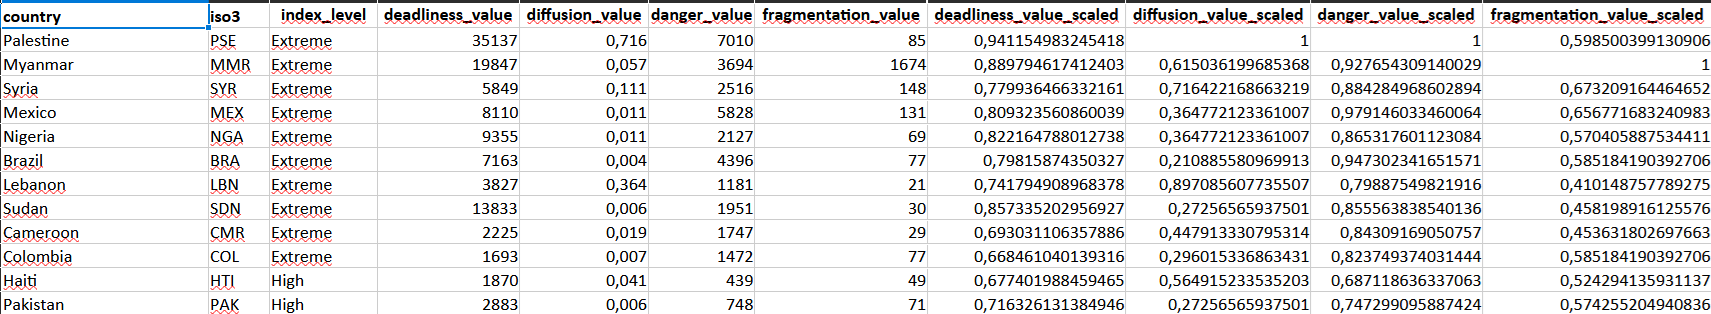
acled_index
Source: acled_index_december_2024_log.csv Downloaded file: acled_index_december_2024
 Link: https://developer.acleddata.com/dashboard/conflict-index-tool/
Description: Data for ACLED conflict index 4 dimensions.
Data Manipulation: Recalculated the value_scaled columns. Previously, it was value/max(value). Now, it is (log(value)/log(max(value))) if not 0, otherwise 0. For diffusion, numbers are multiplied by 100.
Update Frequency: Yearly (December)
Dependent Visualizations: radarChartAcled
Link: https://developer.acleddata.com/dashboard/conflict-index-tool/
Description: Data for ACLED conflict index 4 dimensions.
Data Manipulation: Recalculated the value_scaled columns. Previously, it was value/max(value). Now, it is (log(value)/log(max(value))) if not 0, otherwise 0. For diffusion, numbers are multiplied by 100.
Update Frequency: Yearly (December)
Dependent Visualizations: radarChartAcled
acled_events
Source: ACLED API
 Link outdated: https://api.acleddata.com/acled/read/?key=KEY&email=EMAIL&iso=ISOCOUNTRY
Link from 2025 june: First select an authorization token https://acleddata.com/oauth/token, then https://acleddata.com/api/acled/read with headers={"Authorization": f"Bearer {my_token}", "Content-Type": "application/json"} Description: ACLED conflict data for all selected countries. It is used in many visualizations Data Manipulation: When API data is stored in the database, the latitude and longitude columns are used to create a new geometry column that will be used afterwards Update Frequency: TBD (Monthly) Dependent Visualizations: map, numEvents, numFatalities, histogramChart, Admin1Acled, eventAcledTable, acledTable, subeventAcledTable, eventscatterplotChart, eventSankeyDiagram, acledAdm2scatterplotChart, (locationSankeyDiagram if included), VACEvents, VACFatalities, VAChistogramChart, actorsAcledTable, actorscatterplotChart, actorsChord Additional dependent features: export-json, export-csv
Narratives
All narrative tables are created through the /admin page. They store AI-generated content for each country. The timeline and due diligence processes are long and may exceed the server's acceptable time for operations. It is recommended to check the logs to ensure all data is collected correctly.
The 3 narratives are included in the export PDF functionality.
narrative
Source: None Link: None Description: Country description narrative using OpenAI python library knowledge until the cutoff date (October 2023). Data Manipulation: Prompt is enriched with International Humanitarian Law information. Update Frequency: TBD (Semester or every new knowledge cutoff date) Dependent Visualizations: narrative
timeline
Source: None Link: None Description: 10 events selected with OpenAI python library knowledge with corresponding articles / youtube videos. Data Manipulation: OpenAI library provides a list of 10 events, then other functions are using google search to look for news corresponding to the events from reliable sources (bbc, reuters ...) and extract a picture from these articles. If no corresponding news are found, a search is made on youtube. Update Frequency: TBD (Semester or every new knowledge cutoff date) Dependent Visualizations: timeline
salient
Source: None Link: None Description: FSI data description narrative made with OpenAI python library. Data Manipulation: Prompt contains all FSI data over the years Update Frequency: Yearly Dependent Visualizations: salient
due_diligence
Source: None Link: None Description: due diligence made with OpenAI python library. Data Manipulation: Prompt contains many data: IHL, FSI, ACLED (aggregated and prepared), ACLED global index with their definitions Update Frequency: TBD (Semester or every new knowledge cutoff date) Dependent Visualizations: dd-news
Secondary Sources
icca_point and icca_polygon
Source: Indigenous People and local Communities Registry Link: https://www.iccaregistry.org/ Description: Indigenous people and local communities georeferenced information, in 2 different files: point and polygon. Data Manipulation: latitude and longitude columns are used to create a new geometry column that will be used afterwards Update Frequency: TBD Dependent Visualizations: map
country_mean_coordinates
Source: geojson country reference Link: https://r2.datahub.io/clvyjaryy0000la0cxieg4o8o/main/raw/data/countries.geojson Description: Indigenous people and local communities georeferenced information, in 2 different files: point and polygon. Data Manipulation: a few countries point center have been moved to look better in QGIS Update Frequency: None Dependent Visualizations: map-selection (index.html)
view_grid
Source: Eviews Forecasting Link: https://viewsforecasting.org/gis-resources/ Description: GRID corresponding to the local forecasting. Includes Africa and Middle East Data Manipulation: Using the various resources, each grid has been linked to an iso3 code. From source file MatchingTable_PRIO-GRID_to_CountryID.csv, Check reduce_duplication_views.py, GRID_to_iso3, GRID_to_CountryID and gw_to_iso3 to see how it was done. Update Frequency: TBD Dependent Visualizations: map
System
All backup tables correspond to the narratives and are generated automatically while using the /admin page
sector_risks
Source: PeaceNexus Link: None Description: Sector of interest for investors Data Manipulation: manually created Update Frequency: None Dependent Visualizations: dd-text, dd-news
updates
Source: None Link: None Description: Save the last tables changed for quick debug. Data Manipulation: None Update Frequency: Automatic Dependent Visualizations: None
users
Source: None Link: None Description: Save the users registered in the login page Data Manipulation: None Update Frequency: Automatic Dependent Visualizations: None